Springer Nature · Researcher Engagement Initiative
Designing a
Loyalty Ecosystem
for Academic
Contributors
Details anonymized due to confidentiality
60-second summary
Problem
High participation, weak return behaviour. Nothing brought researchers back once a submission was done.
My role
Led UX end to end, from research synthesis through architecture, tiered design, and A/B experimentation.
Key decisions
- Moved loyalty out of the Author Dashboard into a platform with its own identity.
- Led with recognition rather than discounts, against the initial stakeholder push.
- Two tiers, same structure, distinct visual identity.
Outcome
12% engagement uplift across 43k contributors, with personalisation confirmed as the strongest driver.
01 · Role & Context
Leading UX for a contributor loyalty initiative at scale
I led UX for a contributor loyalty initiative reaching 43,000+ academic contributors, aligning product, research, and content around one experience.
Scope of ownership
The contributor experience from discovery to retention, research synthesis, and the engagement model built to last.
Team & tools
Paired with a UX researcher on study design and synthesis, across product, engineering, and editorial. Dovetail for AI assisted clustering.
The core tension
Recognition without condescension, personalisation without surveillance, for researchers who see commercial publishing clearly.
Target audience
Mid to senior Power Authors and repeat contributors, who shape where their networks submit.
02 · Problem & Insight
Strong participation, weak return behaviour
Participation was high, but engagement fell away after submission. No continuity, no visible progress, no reason to return.
Interviews, behavioural analysis, and AI assisted clustering surfaced the same three gaps: contribution went unrecognised, the experience was transactional, and nothing carried identity.
What actually drives behaviour
Contributors expected discounts, given what publishing costs. That was a baseline expectation, not a driver. What moved behaviour was recognition inside the research community.
A critical segmentation insight
One segment published regardless of any incentive. Not every user needs intervention, and the opportunity sat with repeat contributors.
Reframing the problem
The question moved from "how do we incentivise contributors" to "how do we change return behaviour".
03 · Strategy
Designing for sustained engagement, not one time incentives
Rather than optimising for one driver, the system balanced what contributors expected, discounts and financial support, against what actually moved them, recognition and visibility. The goal throughout was repeat submissions, not satisfaction scores.
04 · Experience Design
From a feature to a platform
The original plan buried loyalty inside the Author Dashboard, which capped its perceived value. I argued for a standalone platform with its own identity.
Tiered experiences
Two tiers, Key Contributors and Authors, sharing one structure but differing in personalisation and visual identity. Progression without fragmenting the product.
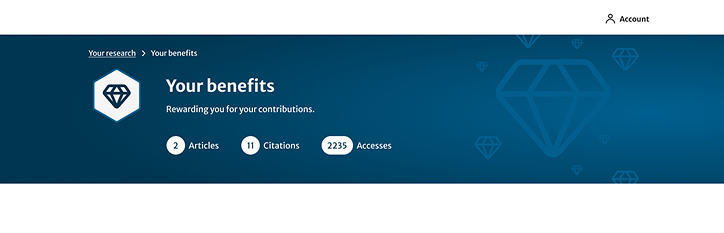
Key Contributor: Navy hero, diamond badge, personalised shortcuts, research stats.
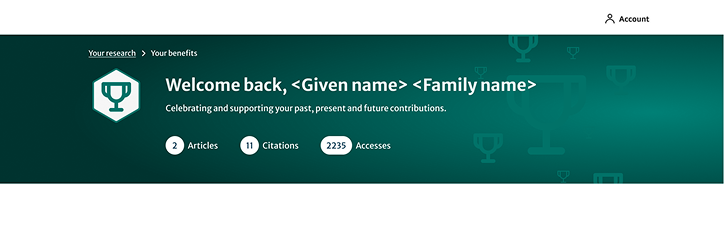
Standard Author: Teal identity, same page structure, core benefits suite.
Perception through visual identity
Colour signals value before anyone reads a word. Navy reads as authority, teal reads as growth, and tier is legible instantly.
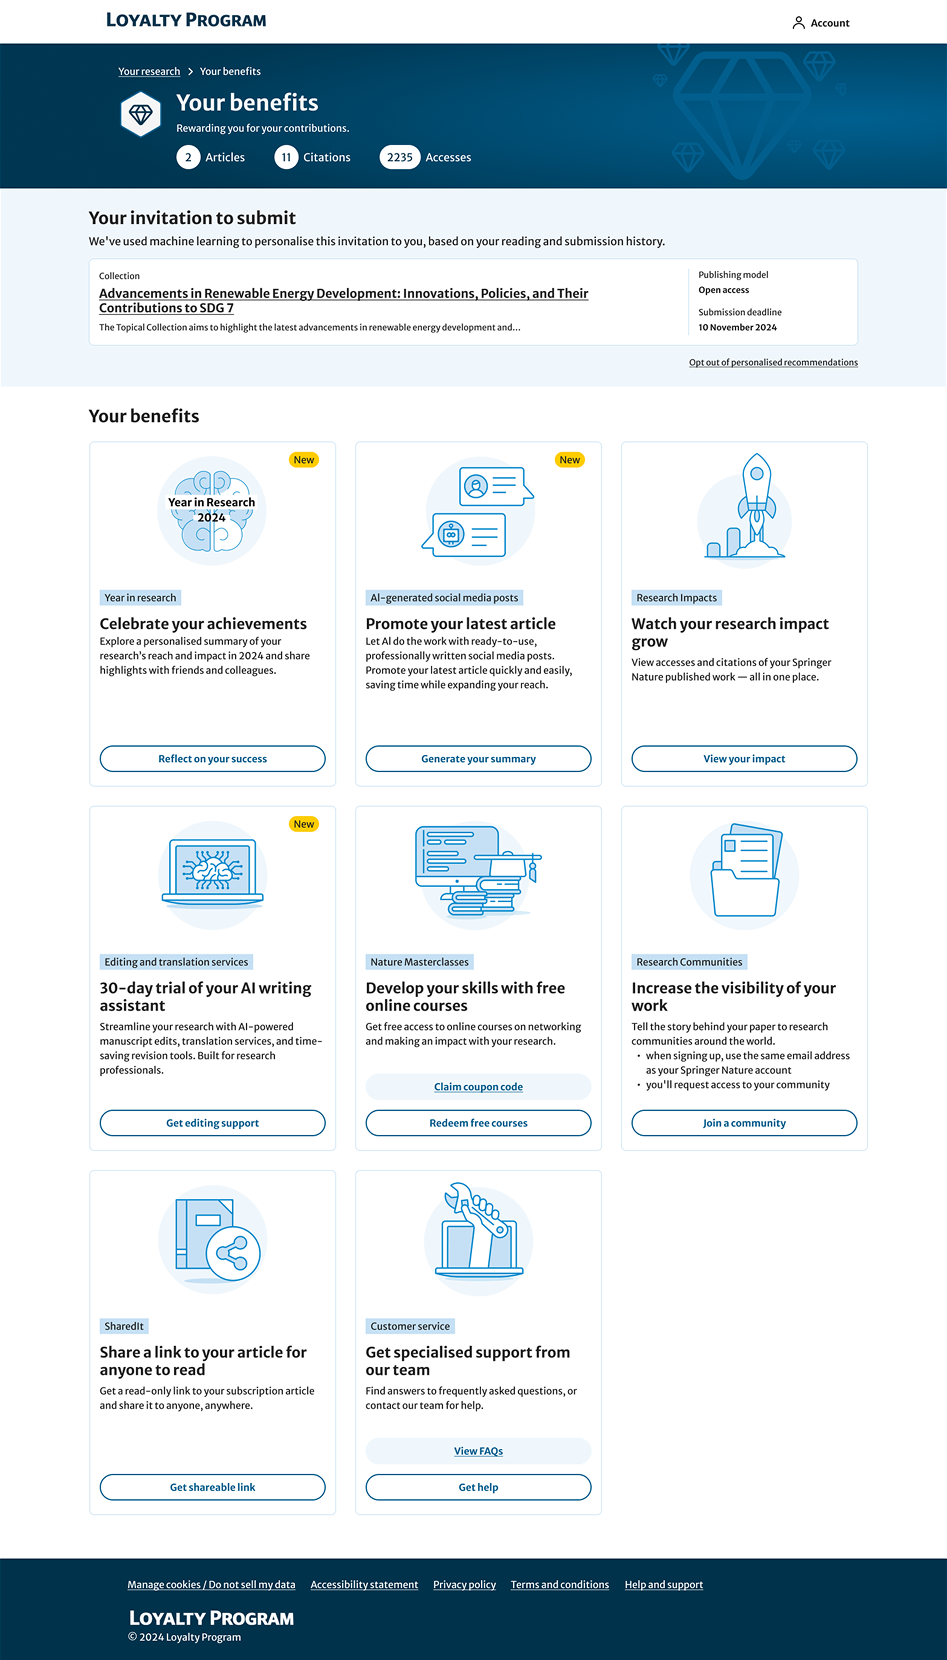
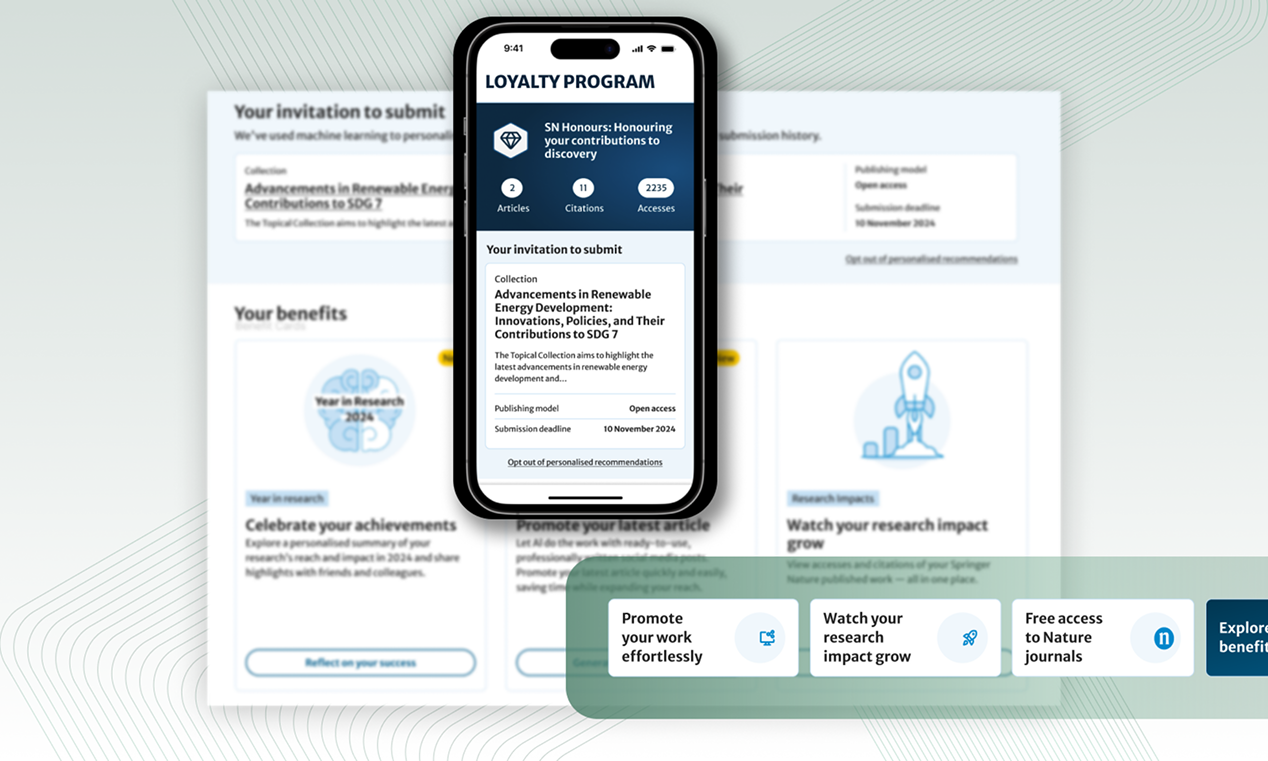
Final platform: Standalone loyalty page with modular benefit cards, personalised invitation carousel, and category filtering.
05 · Testing What Drives Engagement
Moving from assumptions to evidence
Social proof and decision confidence
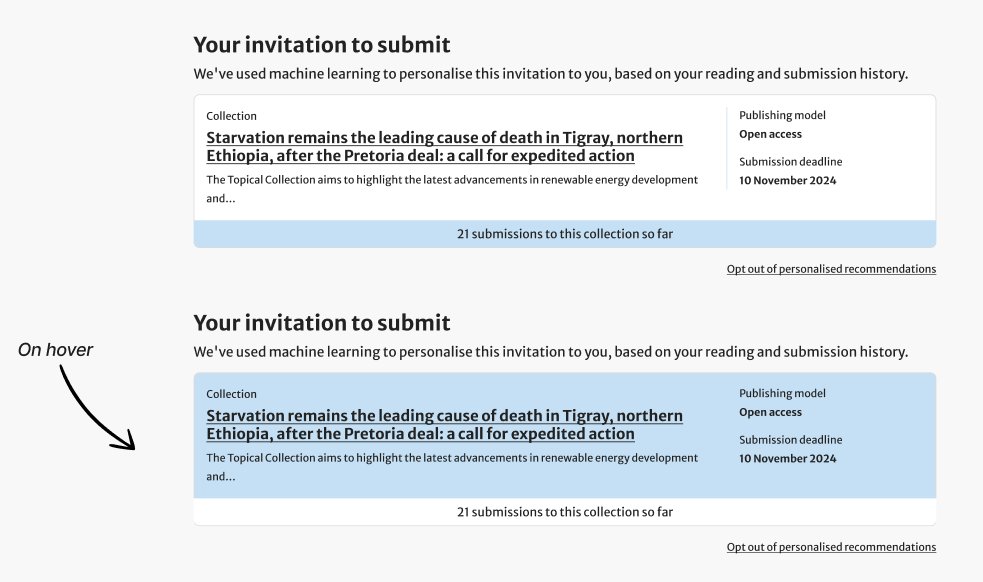
Community signals such as "21 submissions to this collection so far" framed participation as momentum rather than scarcity.
A/B Experiment · Social Proof
"21 submissions to this collection so far"
The submission count beat the neutral control. Researchers responded to momentum framed as information, not as pressure.
Recognition as a retention driver
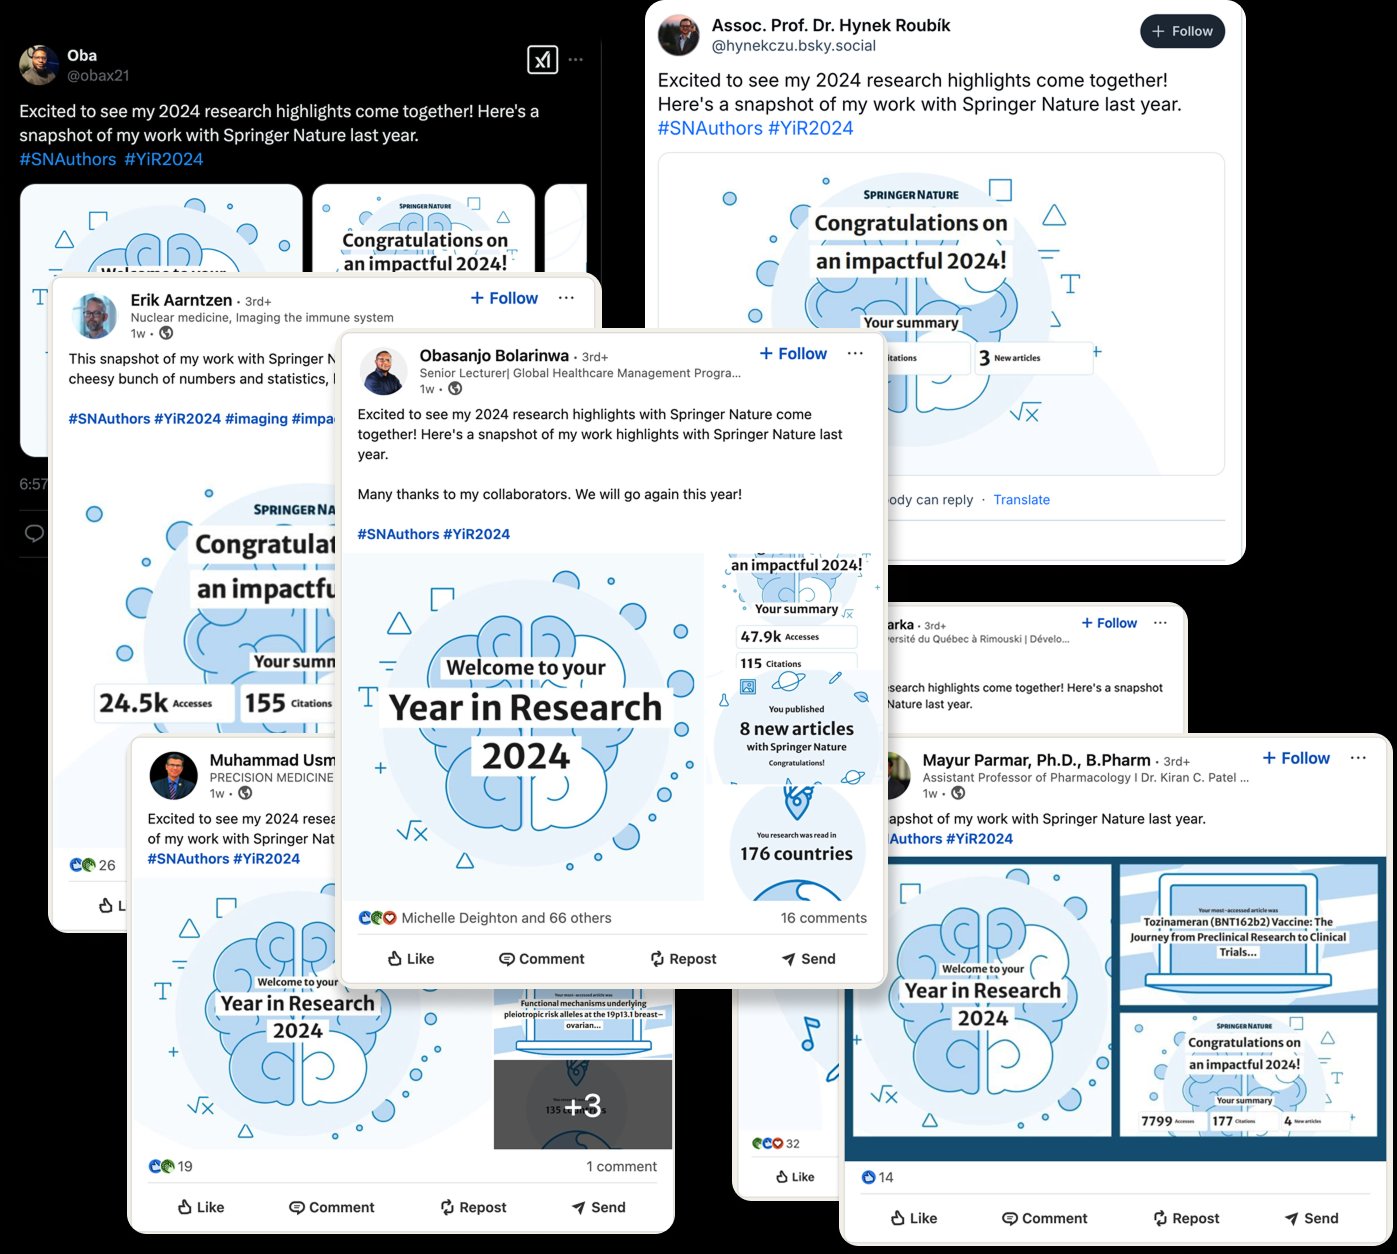
Then features built on identity and visibility: Year in Research summaries and personalised contribution highlights.
Recognition · Year in Research
Personalised research highlights
Engagement rose, and contributors shared their summaries unprompted on LinkedIn and Bluesky. People do not share something they find patronising.
06 · What Actually Worked
Key learnings from experimentation
Urgency signals
Short term lift, no sustained impact.
Verdict
Killed it.
Incentives (discounts)
Expected, but never enough on their own to bring anyone back.
Verdict
Baseline expectation, not a differentiator.
Recognition and visibility
Strongest drivers across every segment tested.
Verdict
Primary design direction.
Personalisation
The strongest lever across every touchpoint, for engagement and for sharing.
Verdict
Top confirmed driver.
07 · Key Decisions & Tradeoffs
Balancing expectations, evidence, and scale
Each decision meant holding a line with stakeholders while keeping the direction grounded in research.
A moment of pushback
The initial push was hard toward discount led incentives. They mattered, but they could not sustain engagement. I reframed the conversation around contributor identity and recognition, and that moved the product to a model we could actually keep funding.
08 · Leadership & Complexity
Leading under pressure and ambiguity
Delivery pressure and shifting expectations, across teams in four time zones.
Across time zones
London, Lisbon, Berlin, and India, with little overlap and constant delivery pressure.
Beyond defined roles
I was the only designer with both visual and design system experience, so I covered both.
Stakeholder management
Turned leadership asks into direction, and pushed back with research when needed. My manager backed escalations, but delivery was mine.
User vs business constraints
Contributors wanted money. That was not always possible, so I traded toward value we could sustain.
Improving design handoff
Handoff gaps were causing premature development, so I introduced structured walkthroughs and clear checkpoints.
09 · What I'd do differently
Where it was hard
The architecture reframe needed socialising earlier
Moving from dashboard feature to standalone platform meant renegotiating scope mid project. Sharing the findings earlier would have smoothed it.
Discount led loyalty was politically hard to deprioritise
Senior stakeholders were sure APC discounts were the driver. Our research said otherwise, and defending that took several reviews.
Test smaller hypotheses earlier
Lightweight experiments first would have validated the behavioural assumptions before we built the larger framework.
10 · Impact
Measurable outcomes at scale
11 · Reflection
Designing for trust as a system
For an academic audience this informed, perceived respect is not a detail. It is the foundation.
Moving from a feature to a platform said something: contributors are participants in the system, not users of it. That meant treating trust as a design material rather than a nice outcome.
Research Artefacts